The UK’s Genetic Clusters

I always enjoy the combination of two of my interests: data visualisation and genealogy. So this BBC article that references a Nature article piqued my interest. It looks at the distribution of DNA across the United Kingdom and identifies different cluster areas. The most important finding is that the Celts, i.e. the people of Scotland, Northern Ireland, Wales, and Cornwall are not a single genetic group. Another finding of interest to me is that the people of Devon are distinct from both Cornwall and Dorset, Devon’s bordering regions. That interest is because my New England ancestors largely hailed from Devon and Dorset.

The colours don't imply relationships, for what it's worth
The colours don’t imply relationships, for what it’s worth

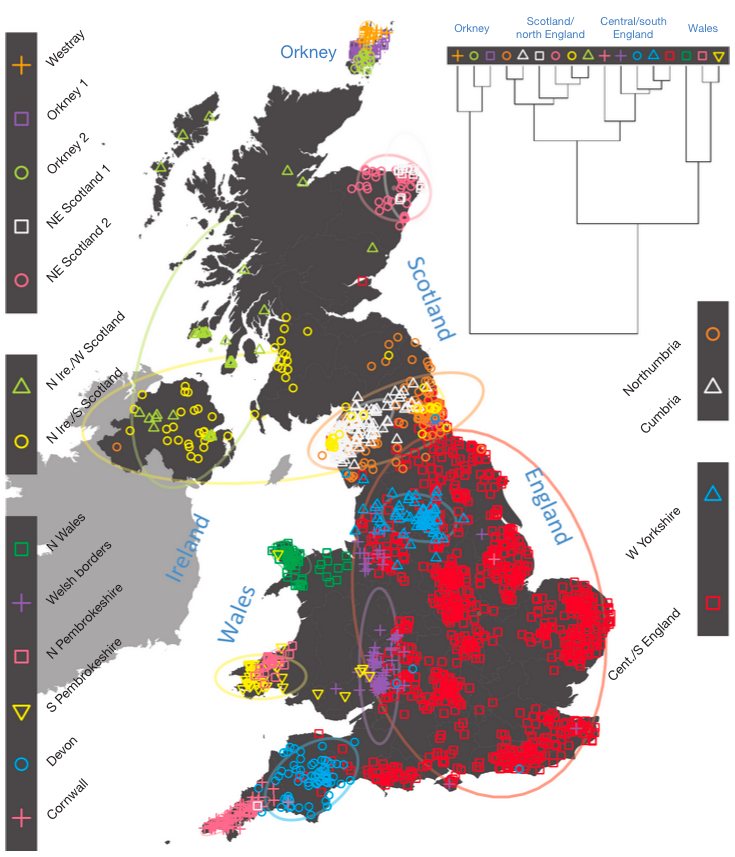
Credit for the piece goes to the Nature article authors.

Tree Maps

Spring is the time for the blossoming of cherry trees. Philadelphia has its own cherry blossom festival, but Washington’s is even bigger. The Washington Post put together a small infographic about the the trees, the symbolism, and the reason behind the presence of Japanese trees in the capital of the United States.

But, mostly I get to say we have a good example of a tree map.

Tree map
Tree map

Credit for the piece goes to Samuel Granados.

Happy St. Patrick’s Day

I am unabashedly Irish-American. So, Happy St. Patrick’s Day. But, I am not the only Irish-American in America. In 2013, Trulia put together a post about the Irish in America using US Census Bureau’s American Community Survey data. The post also links to an interactive map looking at US counties by their self-reporting Irish-ness. Not surprisingly, the Northeast is the most Irish, Philadelphia is the 8th largest metro area at 14.2%.

Chester County
Chester County

Credit for the piece goes to Trulia.

Boston’s Snowy 2015

Boston has finally had it. And by it I mean the snowfall that broke the record. And by record I mean the record for the most snowfall in a year. Well, at least since they started recording it in 1872. The Washington Post has a nice chart placing the season not just in context, but also showing how quickly the snow fell. Most of the snow has fallen only from 25 January onward. And winter is not yet over.

DC is puny compared to  Boston

Credit for the piece goes to Kevin Uhrmacher.

Rainbowship Enterprise

You can rightly file this one under what the fuck, which is how I found it on WTF Visualizations. The piece appears to be some sort of comprehensive guide to minerals, nutrients, and in which foods you can find them. But, as the critique title declares, this is more like Rainbowship Enterprise. How this is supposed to be remotely useful, I cannot even begin to fathom. But, hey, the title references Star Trek, so that’s a redeeming characteristic, right? Oh wait, that was in the criticism…

Set your phasers to stun(ningly bad)

Credit for the original piece goes to Nuique and datadial.

America’s Most Popular Beers—And Almost All Are Crappy

Or so says Adweek. I would heartily disagree about their inclusion of Yuengling in their group of crappy. Though the other nineteen, yeah, I would tend to agree. Regardless, the infographic that sparked the Adweek post is quite blah. I do enjoy the illustrations of the bottles and labels, but the data visualisation below is weak.

The 20 best in table form

So because of Yuengling, I decided to take a quick stab at ways to improve it. My first finding in the data was that the different brands were assigned a Beer Advocate rating, and Yuengling rated the highest—though not terribly high overall. Still, unless you are looking to get drunk, it does offer a good taste/cost value among the consideration set.

Visualising some of the data

Credit for the infographic goes to VinePair.

The Disappearing Polish S

Today’s piece is not a chart, nor is it some complicated piece of data visualisation. Instead, we are looking at a piece from Medium that attempts to explain the disappearing Polish S. Basically, it is a roundabout way of saying that it is very difficult to type in foreign languages on American keyboards because of the additional letters and/or diacritics. If you are at all interested in typography, the article makes nice use of comparative photographs and highlighted colours in the alphabet to illustrate its case.

English vs. Polish alphabets

Credit for the piece goes to Marcin Wichary.

Chipotle and Calories

In my office, Chipotle is a popular fast-casual lunch choice. I am not sure, however, whether people would want to see today’s piece, an article from the New York Times about the nutritional value of a Chipotle meal. The piece makes good use of a few bar charts and nice photographs and table to explain how calorific a burrito there can be. Maybe I should be having a salad for lunch today…

Chipotle calories
Chipotle calories

Credit for the piece goes to Kevin Quealy, Amanda Cox, and Josh Katz.

A Year on Pluto

Last week, NASA’s Dawn probe entered orbit above Ceres, a dwarf planet in the asteroid belt. But later this summer, the New Horizons spacecraft is set to race past Pluto, formerly a planet but now a dwarf planet. New Horizons launched in 2006 and will have taken nine years to reach Pluto. But how long is a year on Pluto? Thanks to the New Horizons team, we can see how one year on Pluto is 248 Earth years, or longer than the history of the independent United States.

A year on Pluto
A year on Pluto

Credit for the piece goes to the NASA/New Horizon team graphics department.

Back to the Future

We began the week with an infographic about Star Trek on account of Leonard Nimoy’s death. We end the week with an xkcd graphic about stories of the past and future and its mentions of Star Trek. Not just for Nimoy, but now also of Harve Bennett, who was a producer instrumental in the production of the movies that solidified Star Trek as a cultural phenomenon.

Stories of the past and future

Credit for the piece goes to Randall Munroe.