Last week we discussed the potential impact of a major nor’easter that struck the East Coast and interrupted testing and vaccination operations in the states we cover: Pennsylvania, New Jersey, Delaware, Virginia, and Illinois (affected by the storm as one of the components moved east across the Midwest).
The possibility of an exaggerated downward trajectory concerned me and that it could be followed with an uptick in new cases and deaths. So a week later, where are we?
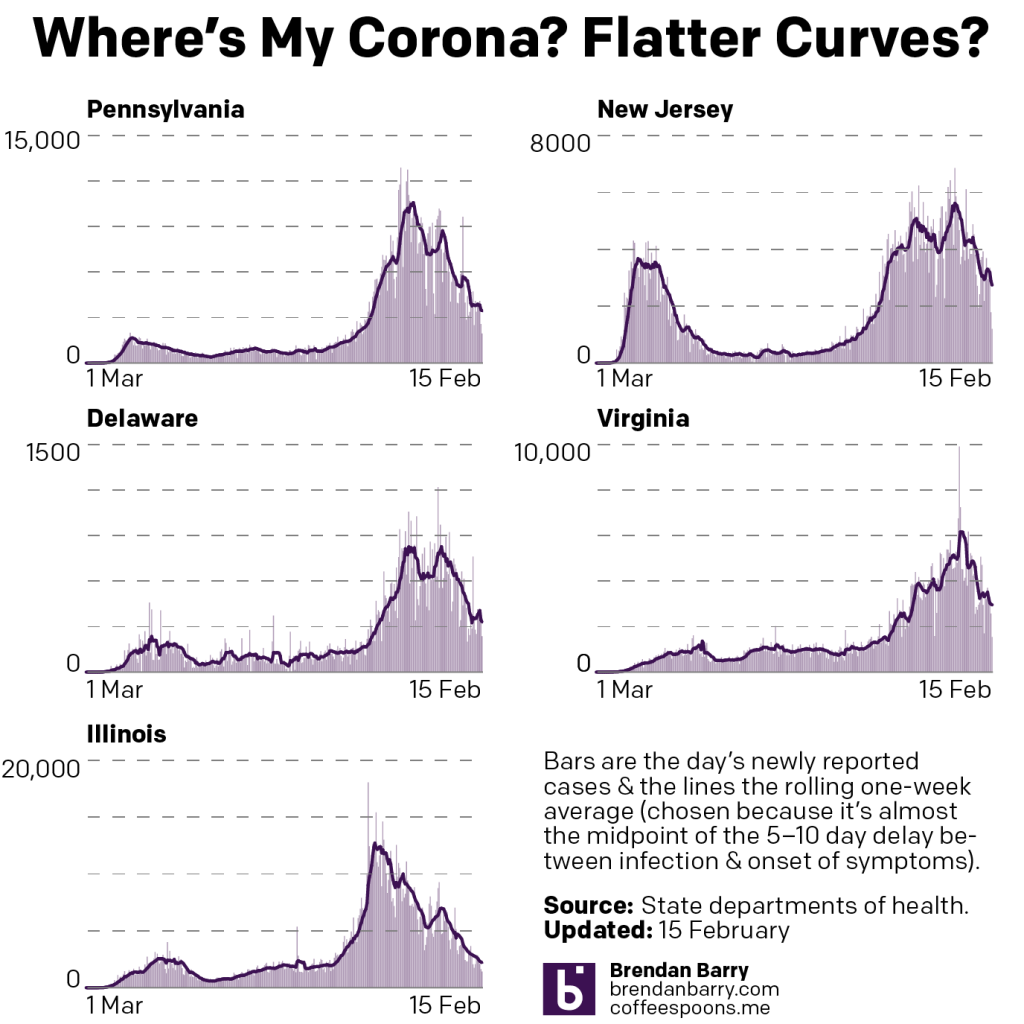
We can see something in the middle. With the exception of Illinois, which has continued its downward trend for new cases, we saw a brief interruption last week. In some cases, like Pennsylvania, that emerged as a rolling seven-day average that began and ended the workweek with the same exact number. And without a lot of variation during the week, you can see that pattern as the flat line towards the end of the chart. As numbers resumed heading down, you can see that beginning of a downward direction at the line’s very end.
In the remaining states of New Jersey, Delaware, and Virginia we saw brief upticks in the seven-day averages with daily spikes of new cases. None of these upticks came anywhere close enough to be threatening—though any upward tick should be monitored—but they were all significant enough to be seen as the quick, upward pointing jogs in the lines. But as we entered the weekend, those numbers also began to drop again.
Next we look at deaths. Last week I described a muddled picture. Delaware and Virginia had begun to rebound and reach or approach new peaks whilst Pennsylvania and Illinois continued to see steady but significant declines. New Jersey fell somewhere between the two. What about this week?
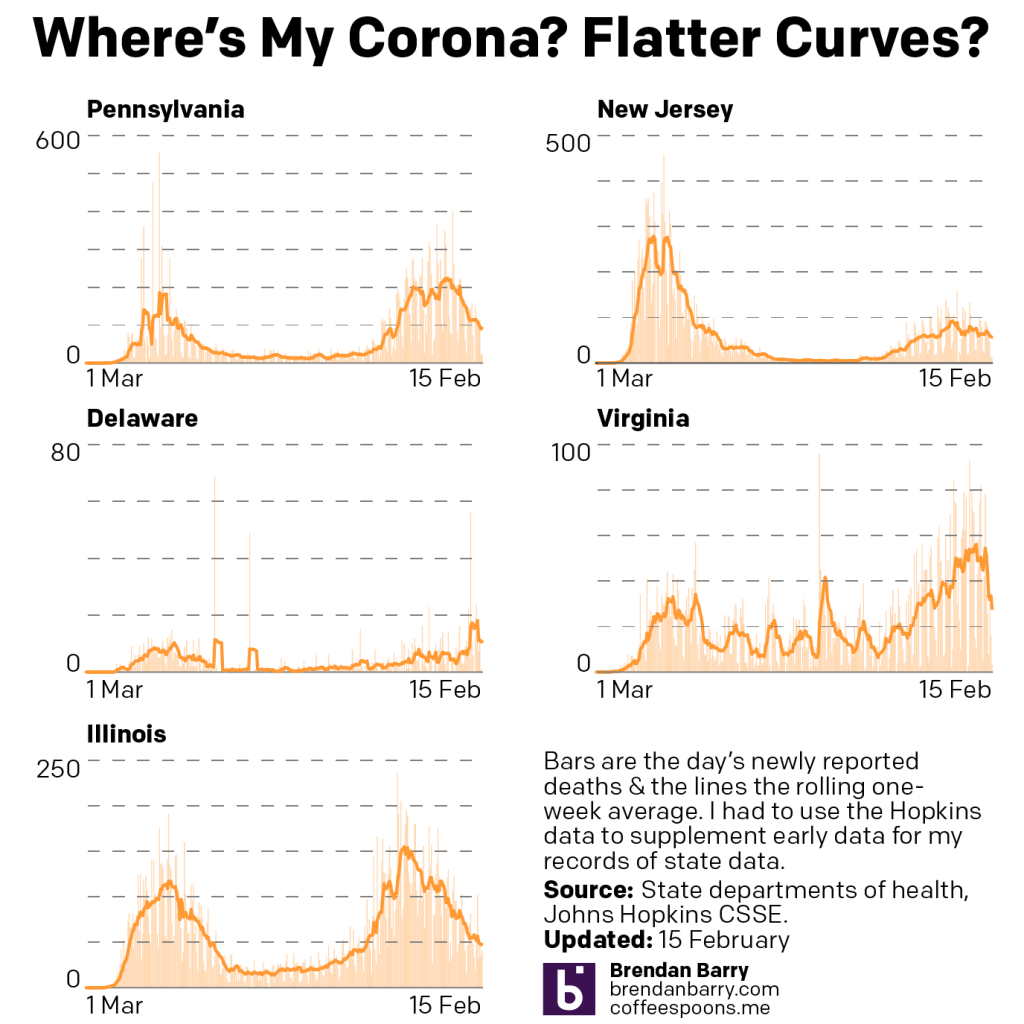
This week is an improved picture. We did see the potential interruption from the storm—Pennsylvania’s death trend evinces the disruption with the same straight line pattern we saw with new cases. But, overall, numbers continue to trend down. Delaware and Virginia show dramatic improvement with steep drops over the last week. And whilst Illinois continues to show steadily declining numbers, New Jersey now falls somewhere near the top of the pile. Its death rate continues to decline very slowly, relative to the other states. But it is heading down.
Finally, a look at vaccinations for Pennsylvania, Virginia, and Illinois.
Last week we talked about how the states all reached at least 2% over the course of the week. Even better news this week.
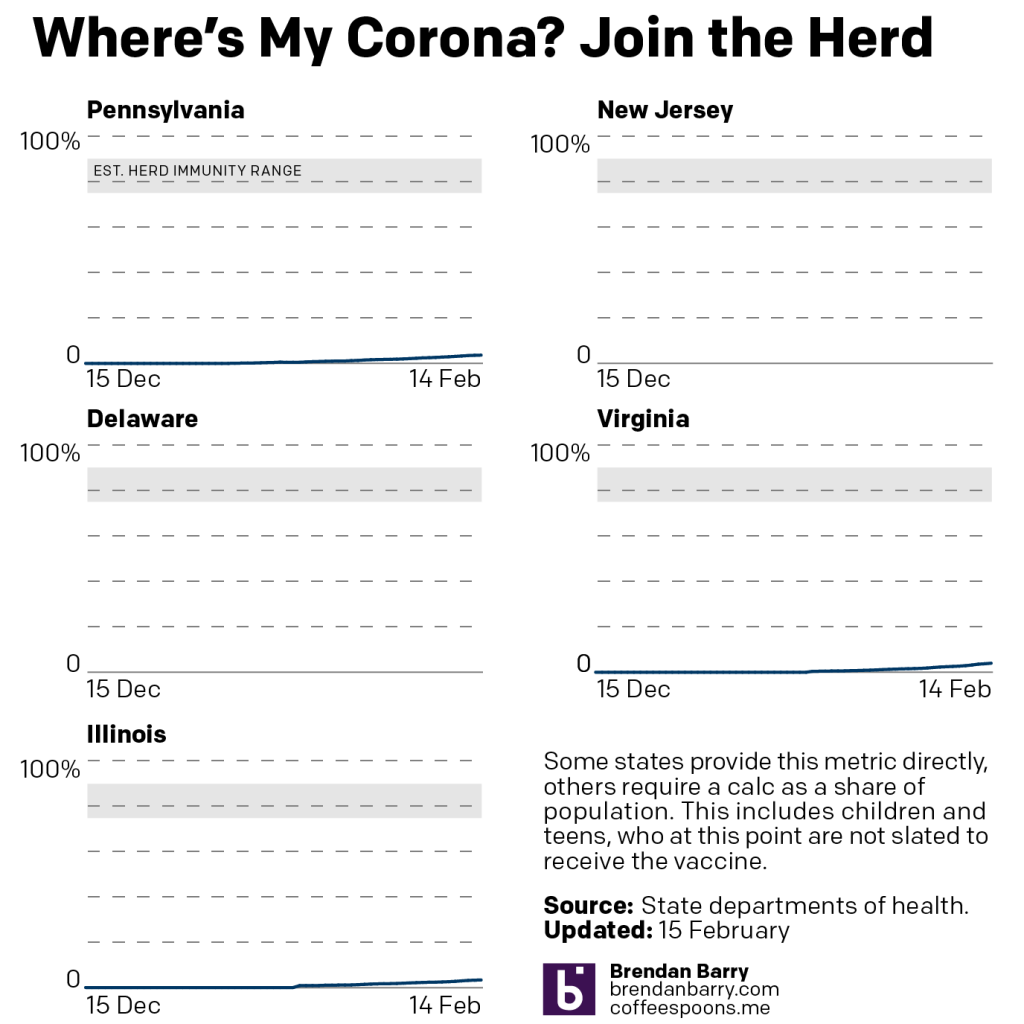
Last week we needed approximately one week to climb one percentage point from 1% to 2%. This week in the same one week time period we saw Virginia climb two percentage points from 2% to 4%. Illinois has slowed its vaccination efforts as it’s still in the mid 3% range. And Pennsylvania is tricky. Because the city of Philadelphia does not report its data on the weekend, we have an incomplete picture until after I post this on Mondays. Even though today is Tuesday, yesterday was a holiday so the same pattern holds true. I would suspect, however, the Commonwealth surpasses 4% later today when the new numbers are released or it comes near to reaching that level.
Credit for the piece is mine.
Leave a Reply
You must be logged in to post a comment.