It’s been a little less than a week since our last Covid-19 update for Pennsylvania, New Jersey, Delaware, Virginia, and Illinois. At the time we had just come back from the Labour Day holiday here in the United States and that left us with two big questions. First, what would the data show after we began to process the tests after the extra time off? Second, would the holiday itself cause any increase in the numbers of new cases?
We also need to remember that last week we had seen some positive signs in some states. And we can start with those states today.
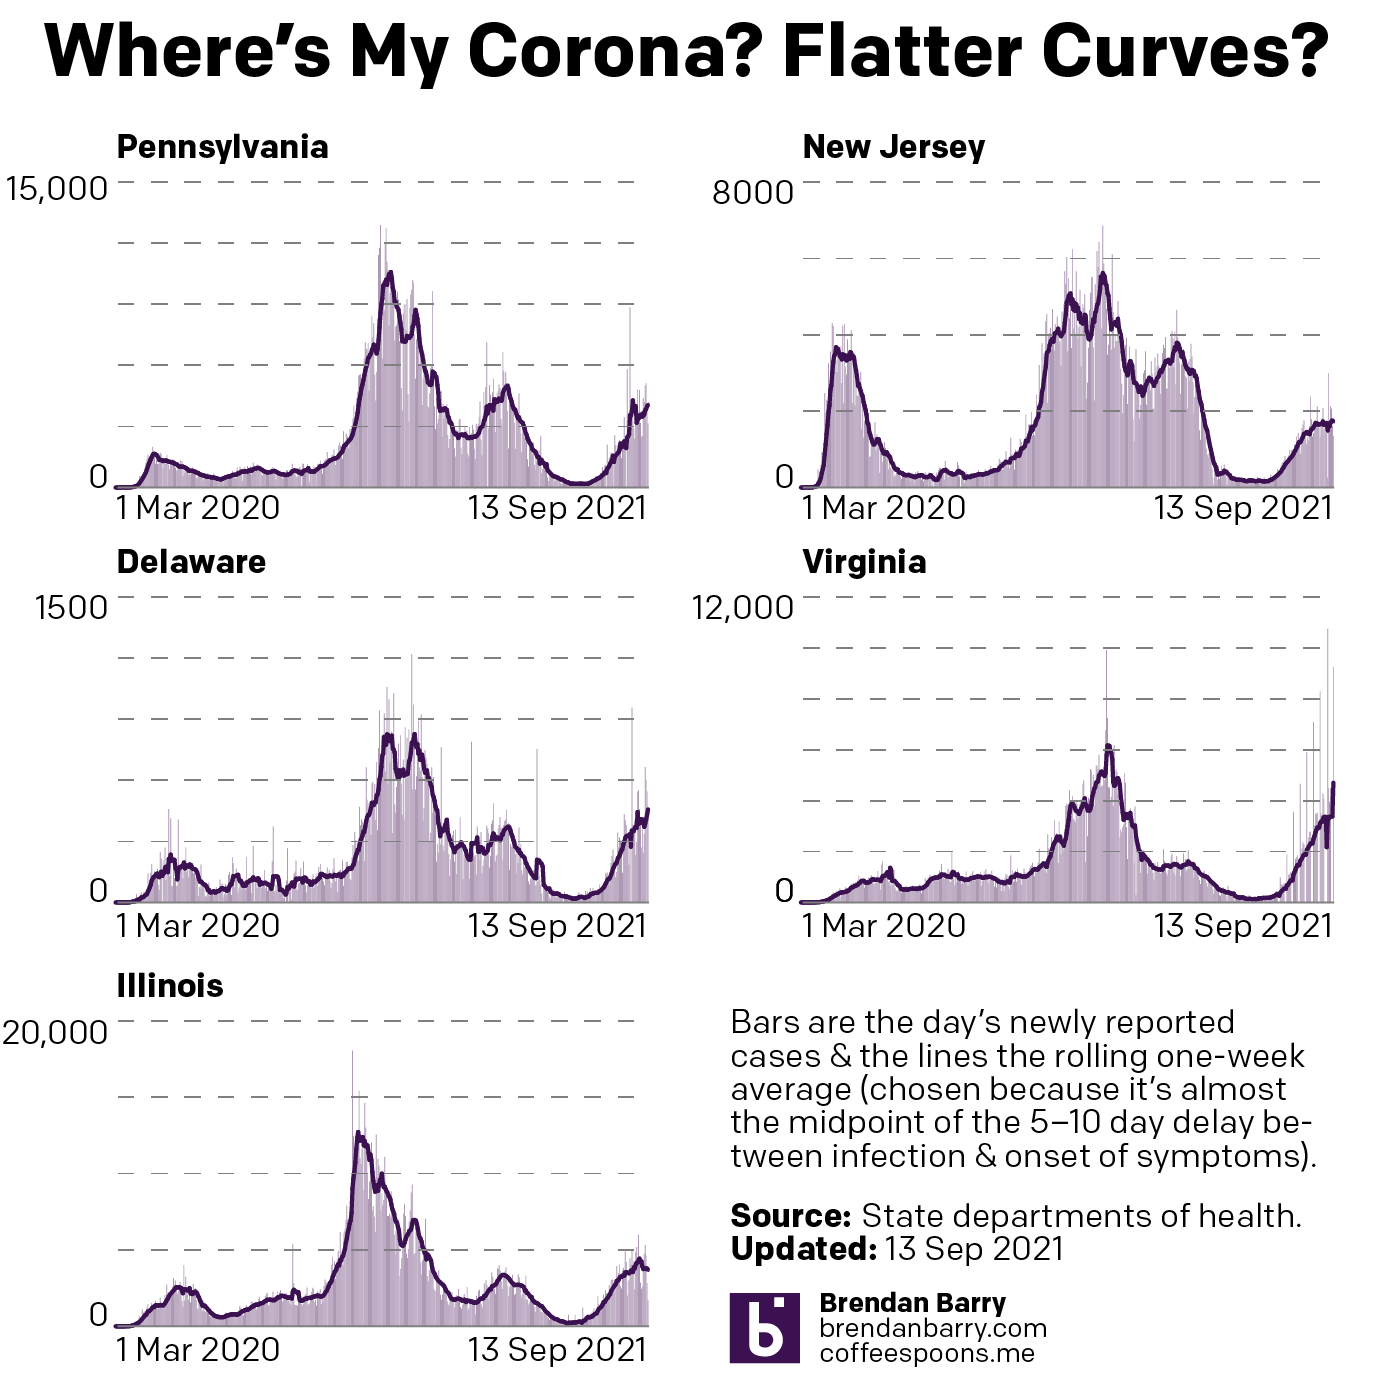
In New Jersey and Illinois we had the clearest evidence of this fourth wave peaking and new cases, whilst still climbing, slowing down with the seven-day average beginning to fall. The good news continues to be that both states continue to show signs their fourth waves have peaked. In fact, Illinois appears to be beginning a downward trajectory. New Jersey has flattened the curve, in other words exhibiting steady numbers of new cases each day.
Delaware appeared to have peaked, but after a brief dip following the holiday, the numbers have begun to shoot back up again. The seven-day average as of yesterday hit 457 new cases per day, exceeding that spike just prior to Labour Day. In other words, it appears that the fear of the holiday increasing rates of new cases, just as they appeared to be peaking came true in Delaware.
What about Virginia and Pennsylvania? Well in the former we had some indications prior to Labour Day that Virginia may have been approaching a peak of new cases. And now you can throw that out the window. Over the three-day holiday weekend, Virginia added just under 11,000 new cases. This past weekend, only two days, Old Dominion added just over 9,200. Not surprisingly the seven-day average spiked upward yesterday to 4,700 new cases per day. If the fourth wave continues at that pace, it will soon surpass the rates we saw last winter.
And in Pennsylvania the data is also not great. We had seen perhaps the beginning of a decline after a peak prior to Labour Day. In the week since? Well, the numbers of new cases have started climbing once again. In fact, yesterday the seven-day average climbed to just under 4,100 new cases per day. That is still below the spring peak and well below winter, but surpasses the numbers we saw just before Labour Day.
In other words, the fear of Labour Day creating new cases appears to have come true.
So then what about deaths? We know that deaths from any increase in cases won’t manifest in the data for a few weeks.
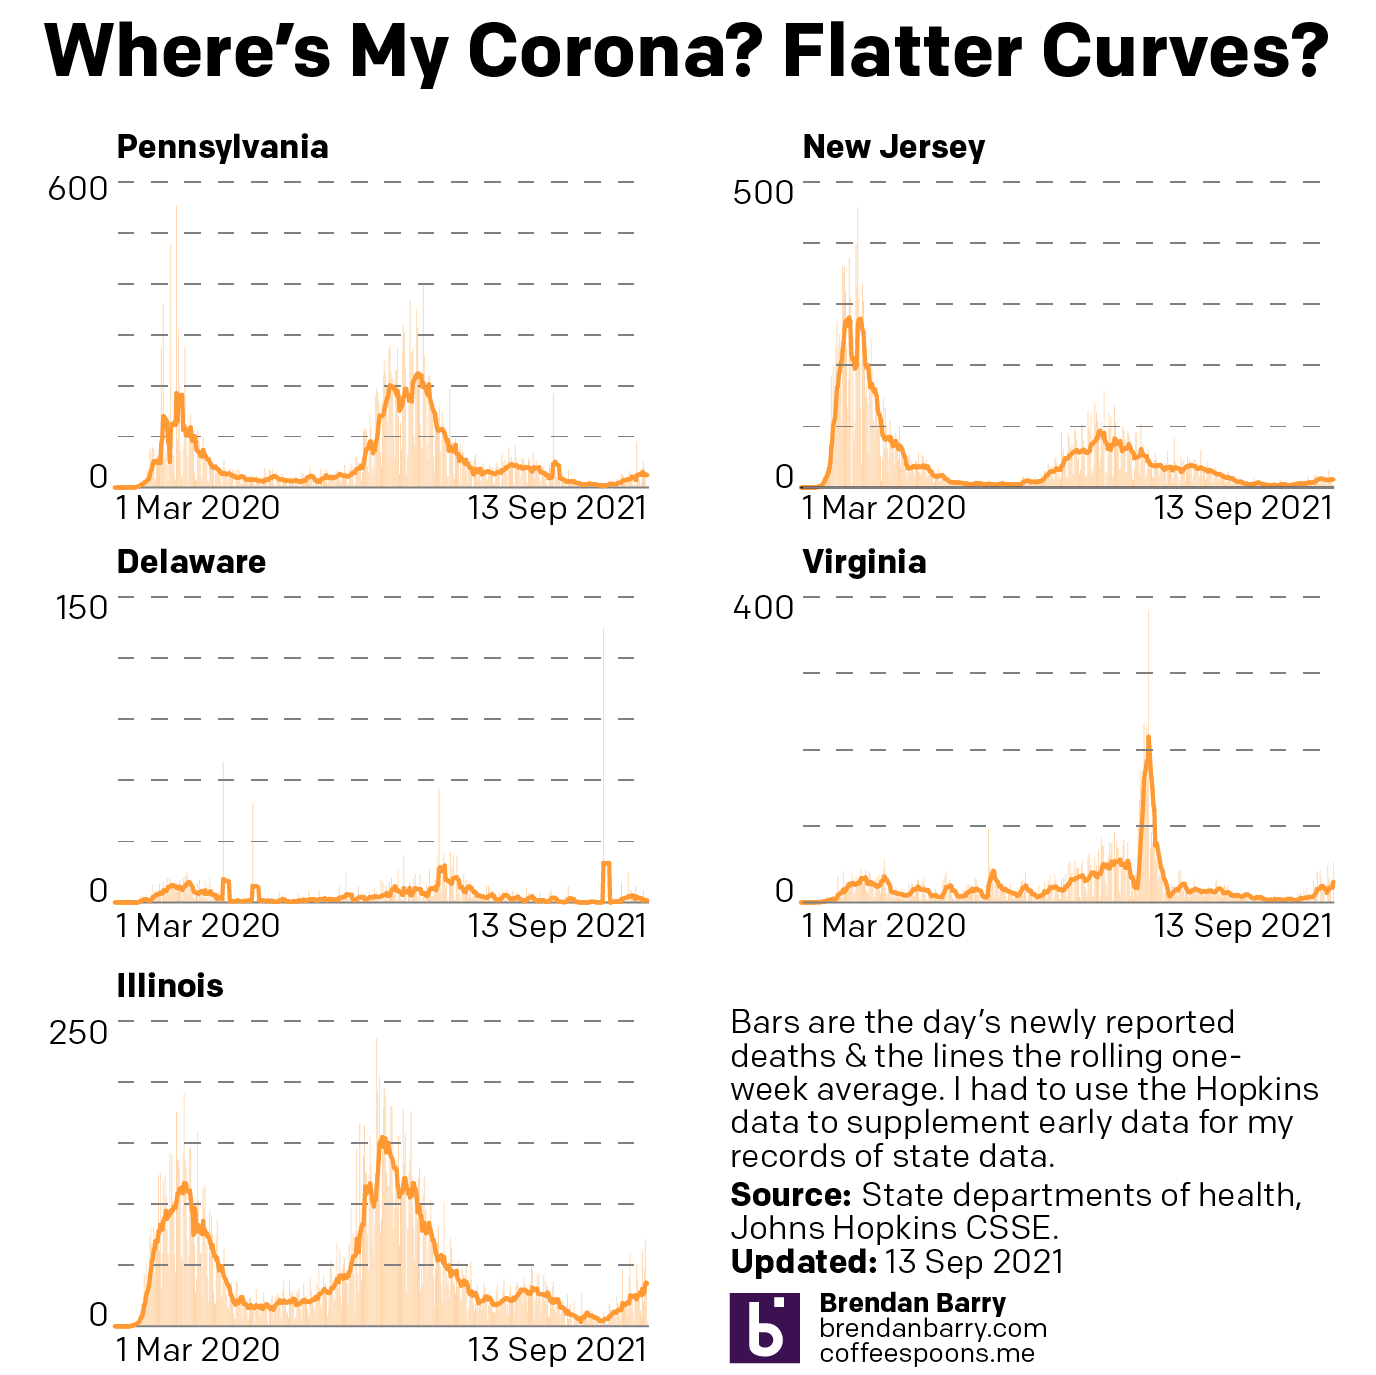
Starting with good news, let’s look at Pennsylvania. Two days after Labour Day the Commonwealth’s seven-day average for deaths reached 30.1 deaths per day. In the almost week since that rate has steadily dropped to 24.3 per day. Ideally we would want to see that trend extend beyond five days. Because if the Labour Day surge persists, it wouldn’t be beyond belief to imagine deaths rising again in coming days.
But that’s also about it for good news. True, Delaware went from 0.9 deaths per day to just 1.0. But that’s more of a stable rate than anything. All the other states have seen their death rates continue to climb of late. Although, we would also expect deaths to peak sometime after the peak in new cases, so this trend makes sense.
In New Jersey deaths climbed from 12.4 to 13.1 per day. Not terrible, but again still an increase in deaths. The worst increases were in Illinois and Virginia. In Illinois deaths have continued to climb, rising from 30.7 last time we wrote to 34.7. But Virginia has seen the worst, despite an apparent dip around Labour Day. Instead people are dying at increasing rates, climbing from 16.7 deaths per day to 27.1 as of yesterday.
Unfortunately, until we see new cases truly peak in Virginia those numbers are likely to continue climbing in coming days and possibly weeks.
Leave a Reply
You must be logged in to post a comment.