In many cities through the United States, real estate represents a hot commodity. It’s not difficult to understand why, as have covered before, Americans are saving a bit more. Coupled with stay-at-home orders in a pandemic, spending that cash on a home down payment makes a lot of sense for a lot of people. But with little new construction, it’s a seller’s market.
The Philadelphia Inquirer covers that angle for the Philadelphia region and in the article, it includes a map looking at time to sell a house. And it’s that interactive map I want to look at briefly this morning.
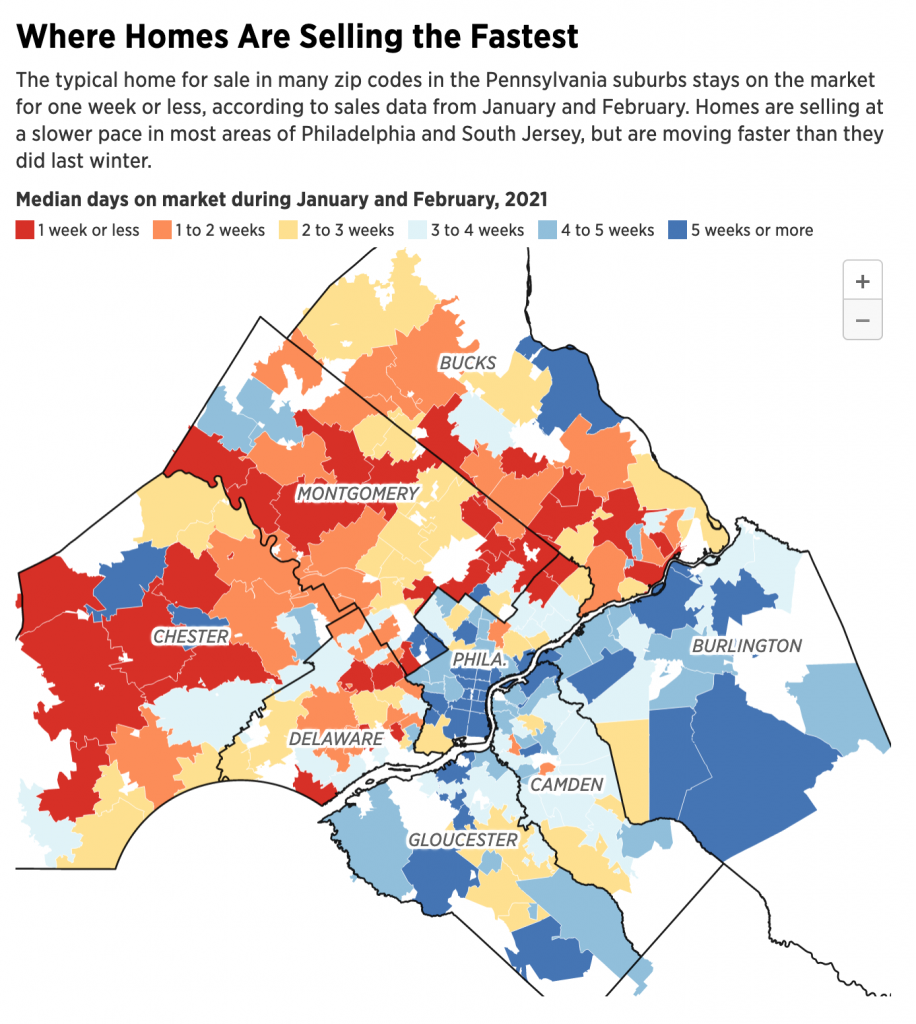
Primarily I want to discuss the colours, as you can gather from this post’s title. We have six bins here, each indicating an amount of time in one-week intervals. So far so good. Now to the colours, we have red for homes that sell in one week or less and blue for homes that sell in five weeks or more.
Blue to red is a pretty standard choice. You will often see it in maps where you have positive growth to negative growth or something similar, I’ve used it myself on Coffeespoons a number of times, like in this map of population growth at the county level here in Pennsylvania.
In those scenarios, however, note how you have positive values and negative values. The change in colour (hue) encodes the change in numerical value, i.e. positive vs. negative. We then encode the values within that positive or negative range with lighter/darker blues and reds. Most often the darker the blue or red, the greater the value toward the end of the spectrum. For example, in Pennsylvania, the dark blue meant population growth greater than 8% and red meant population declines in excess of 8%.
As an aside you’ll note that there are no dark blue counties in that map and that’s by design. By keeping the legend symmetrical in terms of its minimum and maximum values, we can show how no counties experienced rapid population growth whilst several declined rapidly. If dark blue had meant greater than 4% growth, that angle of the story would have been absent from the map.
Back to our choropleth discussion, however. How does that fit with this map of selling times for homes in the Philadelphia region?
Note first that five weeks is a positive value. But so is one week or less. The use of the red-blue split here is not immediately intuitive. If this map were about the change or growth in how long homes sell, certainly you could see positive and negative rates and those would make sense in red and blue.
The second part to understand about a traditional red-blue choropleth is that at some point you have to switch from red to blue, a mid-point if you will. If you are talking positive/negative like in my Pennsylvania map, zero makes a whole lot of sense. Anything above zero, blue, anything below zero red.
Sometimes, you will see a third colour, maybe a grey or a purple, between that red and blue. That encodes a fuzzier split between positive and negative. Say you want to give a margin of 1%, i.e. any geographic area that has growth between +1% and -1%. That intrinsically means the bin is both positive and negative at the same time, so a neutral colour like grey or a blend of the two colours, a purple in the case of red and blue, makes a whole lot of sense.
Here we have nothing like that. Instead we jump from a light yellow two-to-three weeks to a light blue three-to-four weeks.
What about that yellow? In a spectrum of dark blue to light blue, you will see lighter blues than darker blues. But in a red spectrum, that light red becomes pinkish or salmonish depending on that exact type of red you use. (Conversation for another day.) Personal preferences will often push clients to asking a designer to “use less pink” in their maps. I can’t tell you the number of times I’ve heard that.
If that comes up, designers will often keep their blue side of the legend from the dark to light—no complaints there, or at least I’ve never heard any. But for the red side, they’ll switch to using hue or type of colour instead of dark to light red.
Not all colours are as dark as others. Blue and red can be pretty dark. Yellow, however, is a fairly light colour. Imagine if you converted the colours to greyscale, you’ll have very dark greys for blue and red, but yellow will be consistently far lighter than the other two.
The designer can use the light yellow as the light red. But to link the yellow to red, they need to move through the hues or colours between the two. There’s a whole conversation here about colour theory and pigment and light absorption vs. pixels and light emission, but let’s go back to your colours you learned in primary school (pigment and light absorption). Take your colour wheel and what sits between red and yellow? Orange.
And so if a client objects to a light pink, you’ll see a pseudo dark-to-light red spectrum that uses a dark red, a medium orange, and a light yellow. Just like we see here in this Inquirer map.
Back to the two-to-three week and three-to-four week switch, though. What’s the deal? This is my sticking point with the graphic. I am looking for the explanation of why the sudden break in colour here, but I don’t see any obvious one.
Why would you use this colour scheme where blue and red diverge around a non-zero value? Let’s say the average home in the region sells in three weeks, any of the zip codes in red are selling faster than average, hot markets, and those taking longer than average are in blue, cold markets. Maybe it’s the current average, however. What if it were the average last year? Or the national average? These all serve as benchmarks for the presented data and provide valuable context to understand the market.
Unfortunately it’s not clear what, if any, benchmarks the divergence point in this map reflects. And if there is no reason to change colours mid-legend, with only six bins, a designer could find a single colour, a blue or purple for example, and then provide five additional lighter/darker shades of that to indicate increasing/decreasing levels of speed at which homes sell.
Overall, I left this piece a wee bit confused. The general trend of regional differences in how quickly homes are selling? I get that. But because there’s a non-logical break between red and blue here—or at least one I fail to see in the graphic—this map would work almost as well if each bin were a separate colour entirely, using ROYGBIV as a base for example.
Credit for the piece goes to John Duchneskie.
Leave a Reply
You must be logged in to post a comment.